

Overview
The ‘Overview’ provides a centralized view of automation activity across your Blink workspace. It highlights key metrics such as workflow usage, actions automated, time saved, and estimated cost savings, helping teams monitor performance, track impact, and optimize automation at scale. Filters by tenant, workspace, and timeframe allow you to customize the data view to fit your operational needs. Note: Workspace usage data in BlinkOps provides essential insights into automation effectiveness. By tracking workflow execution, action volume, and estimated savings, teams can measure impact, identify optimization opportunities, and better allocate engineering and automation resources. Contact Blink Ops support for limit adjustments.
1
Navigate to Dashboards
Go to the ‘Dashboard’ page by navigating to ‘Tenant Settings’ in your Blink workspace. This page provides a high-level view of usage across all workspaces within the selected tenant.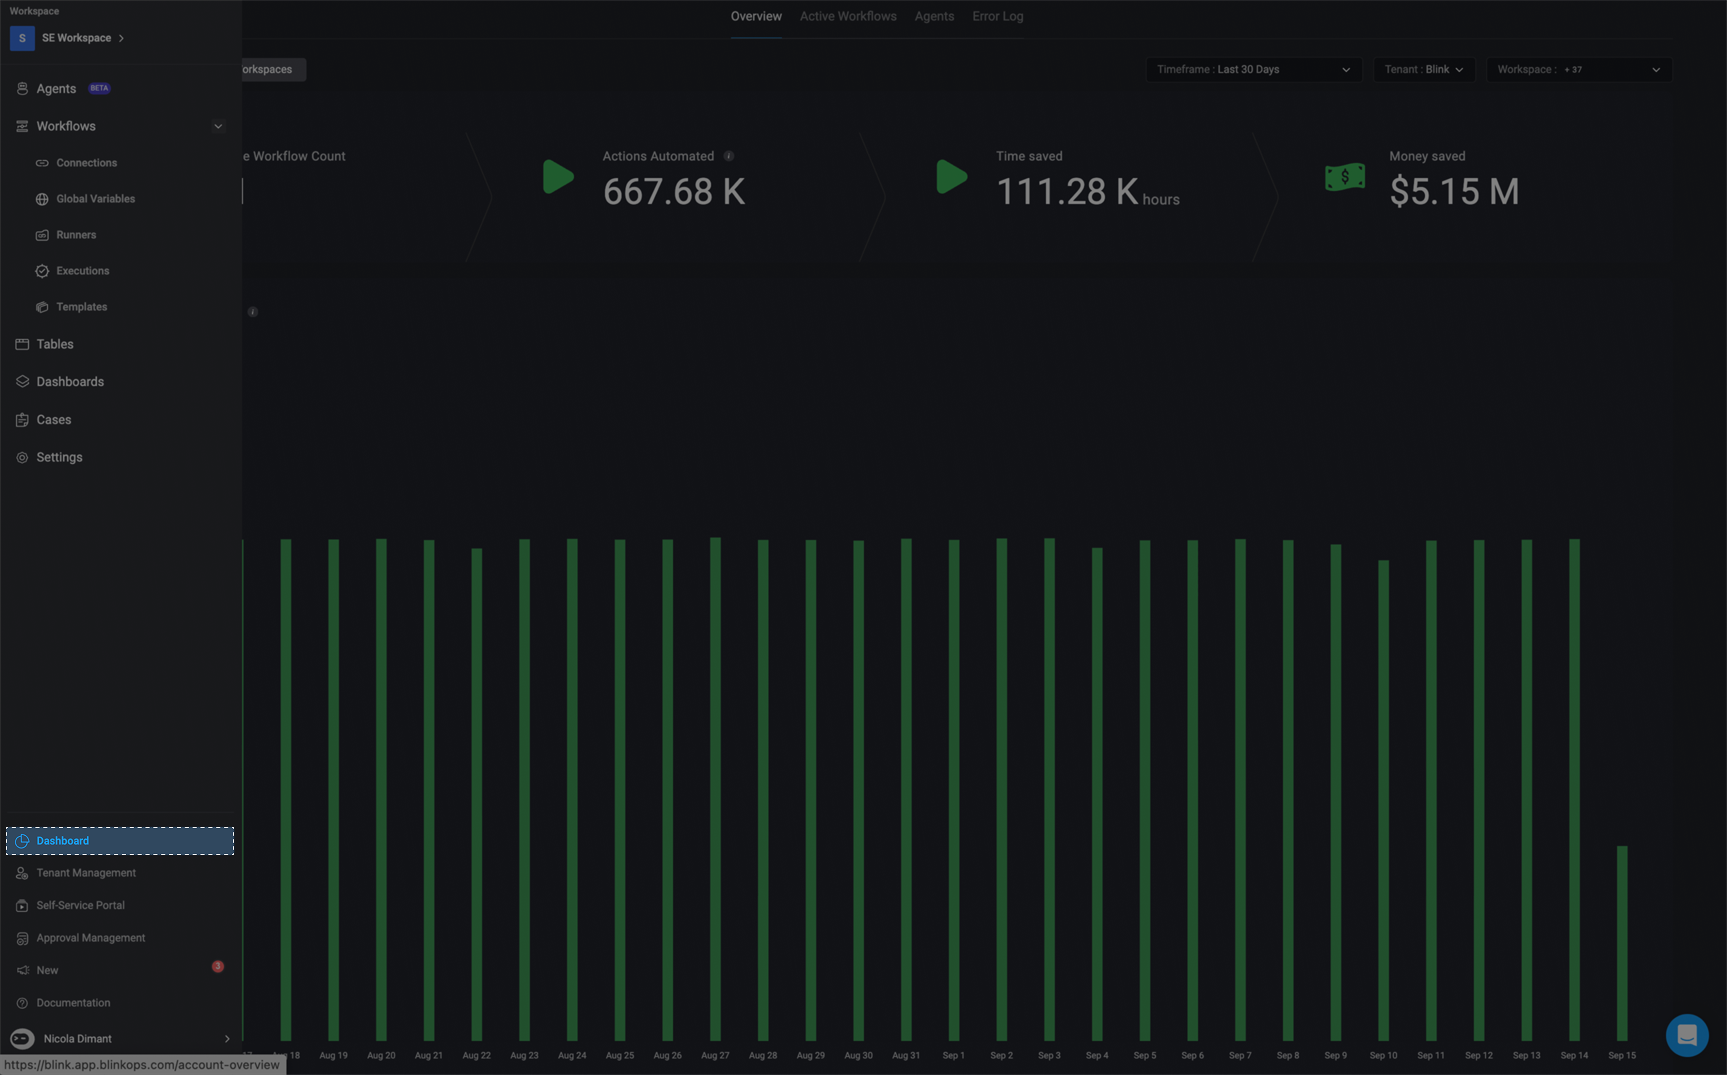
2
In the Overview Tab
In the Overview tab, you can find the usage panel at the top of the page. This section highlights key metrics related to automated workflows across your selected tenants and workspaces, including: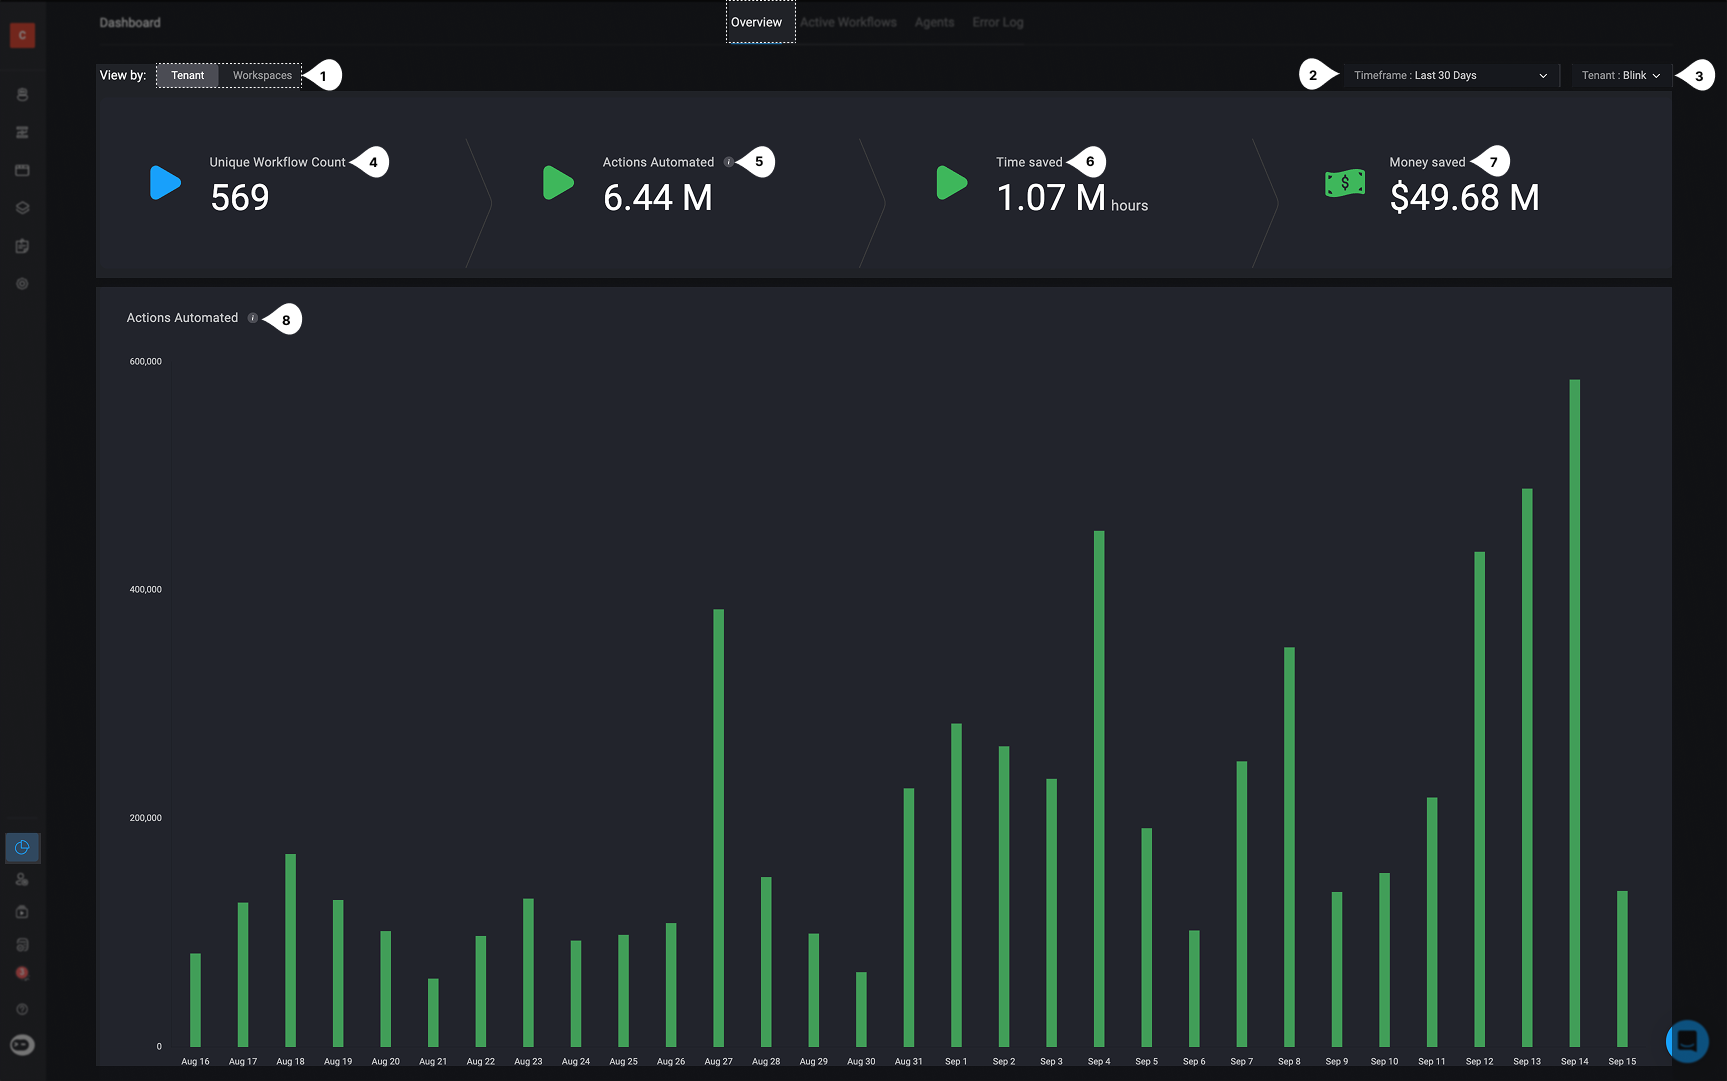
Note: The View by: Tenant is only available to users with the Tenant Admin role who have the
accounts:view permission Calculating Time and Money Saved
1. Time Saved: [Actions Automated] * [An average time per action] * [Unit modifier]2. Money Saved: [Time saved] * [Average cyber security employee salary]/180/12Active Workflows
The Active Workflows section provides detailed visibility into which workflows are being executed, how frequently they run, and the total amount of actions executed in a workspace and tenant. This view helps teams identify high-usage workflows, track vendor utilization, and assess performance across tenants and workspaces, enabling better prioritization, optimization, and scaling of automation efforts.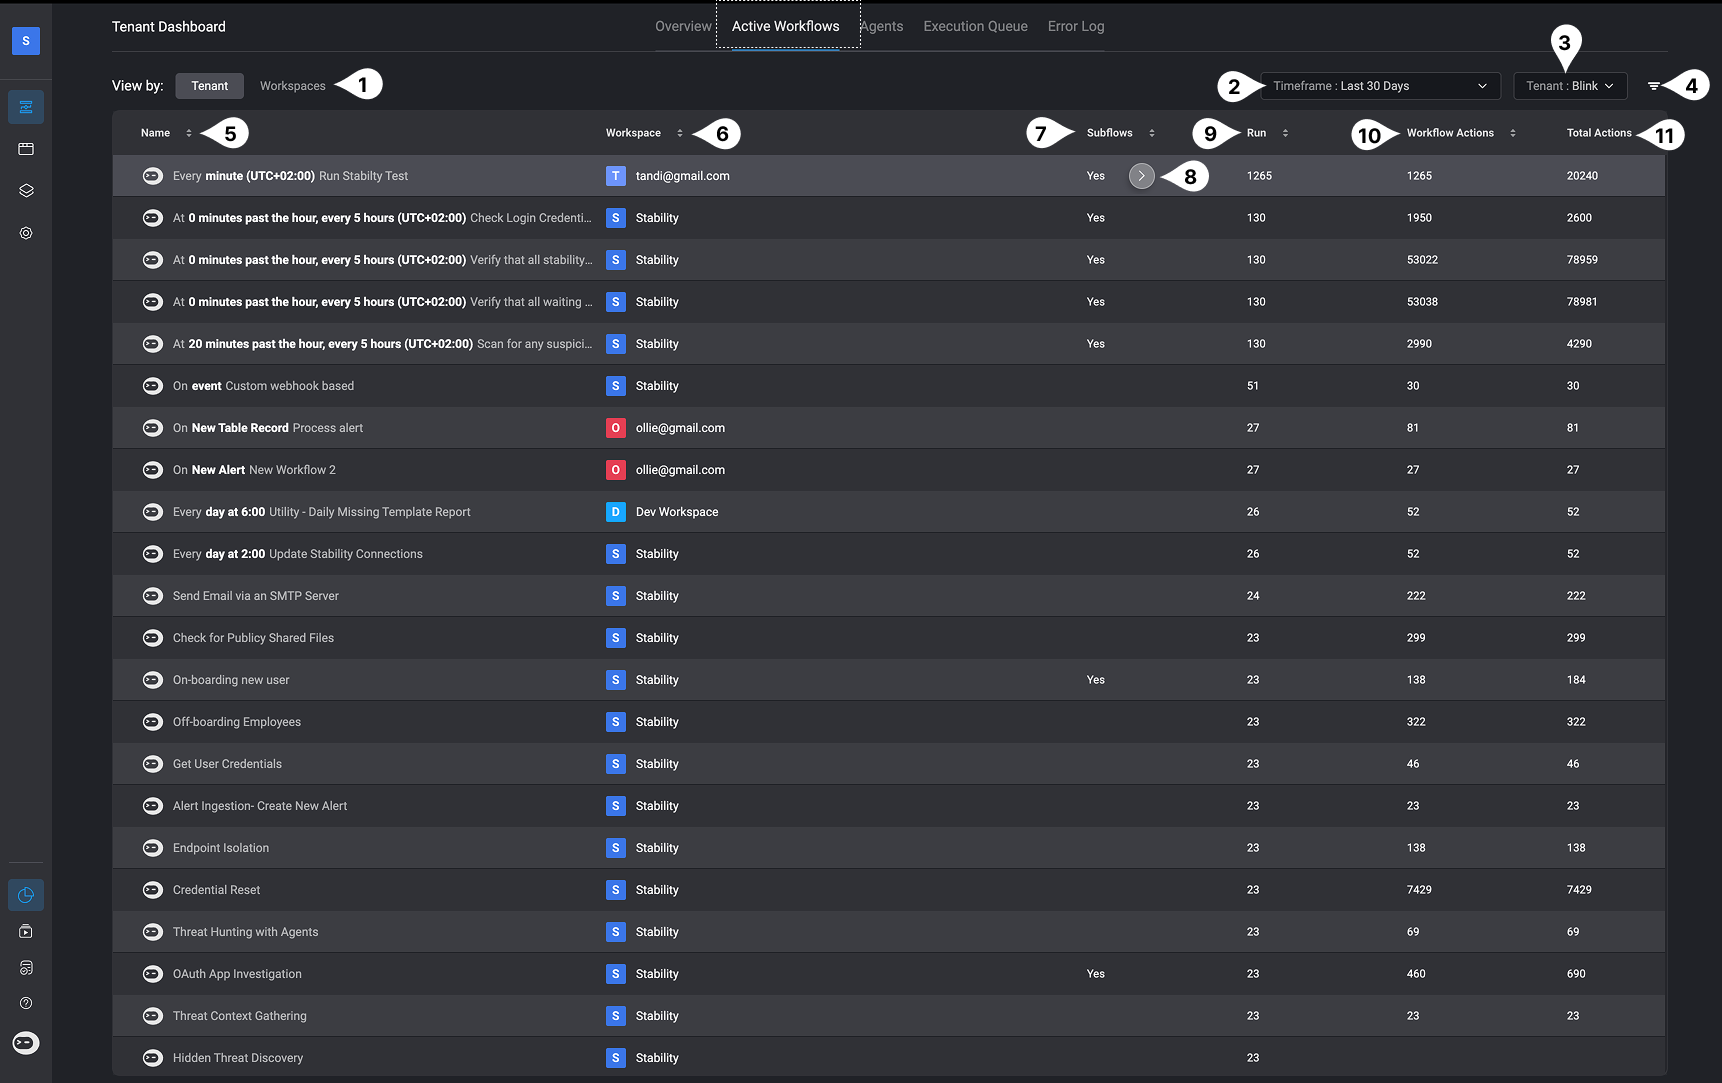
Note: The View by: Tenant is only available to users with the Tenant Admin role who have the
accounts:view permission Subflow Hierarchy in the Parent Workflow
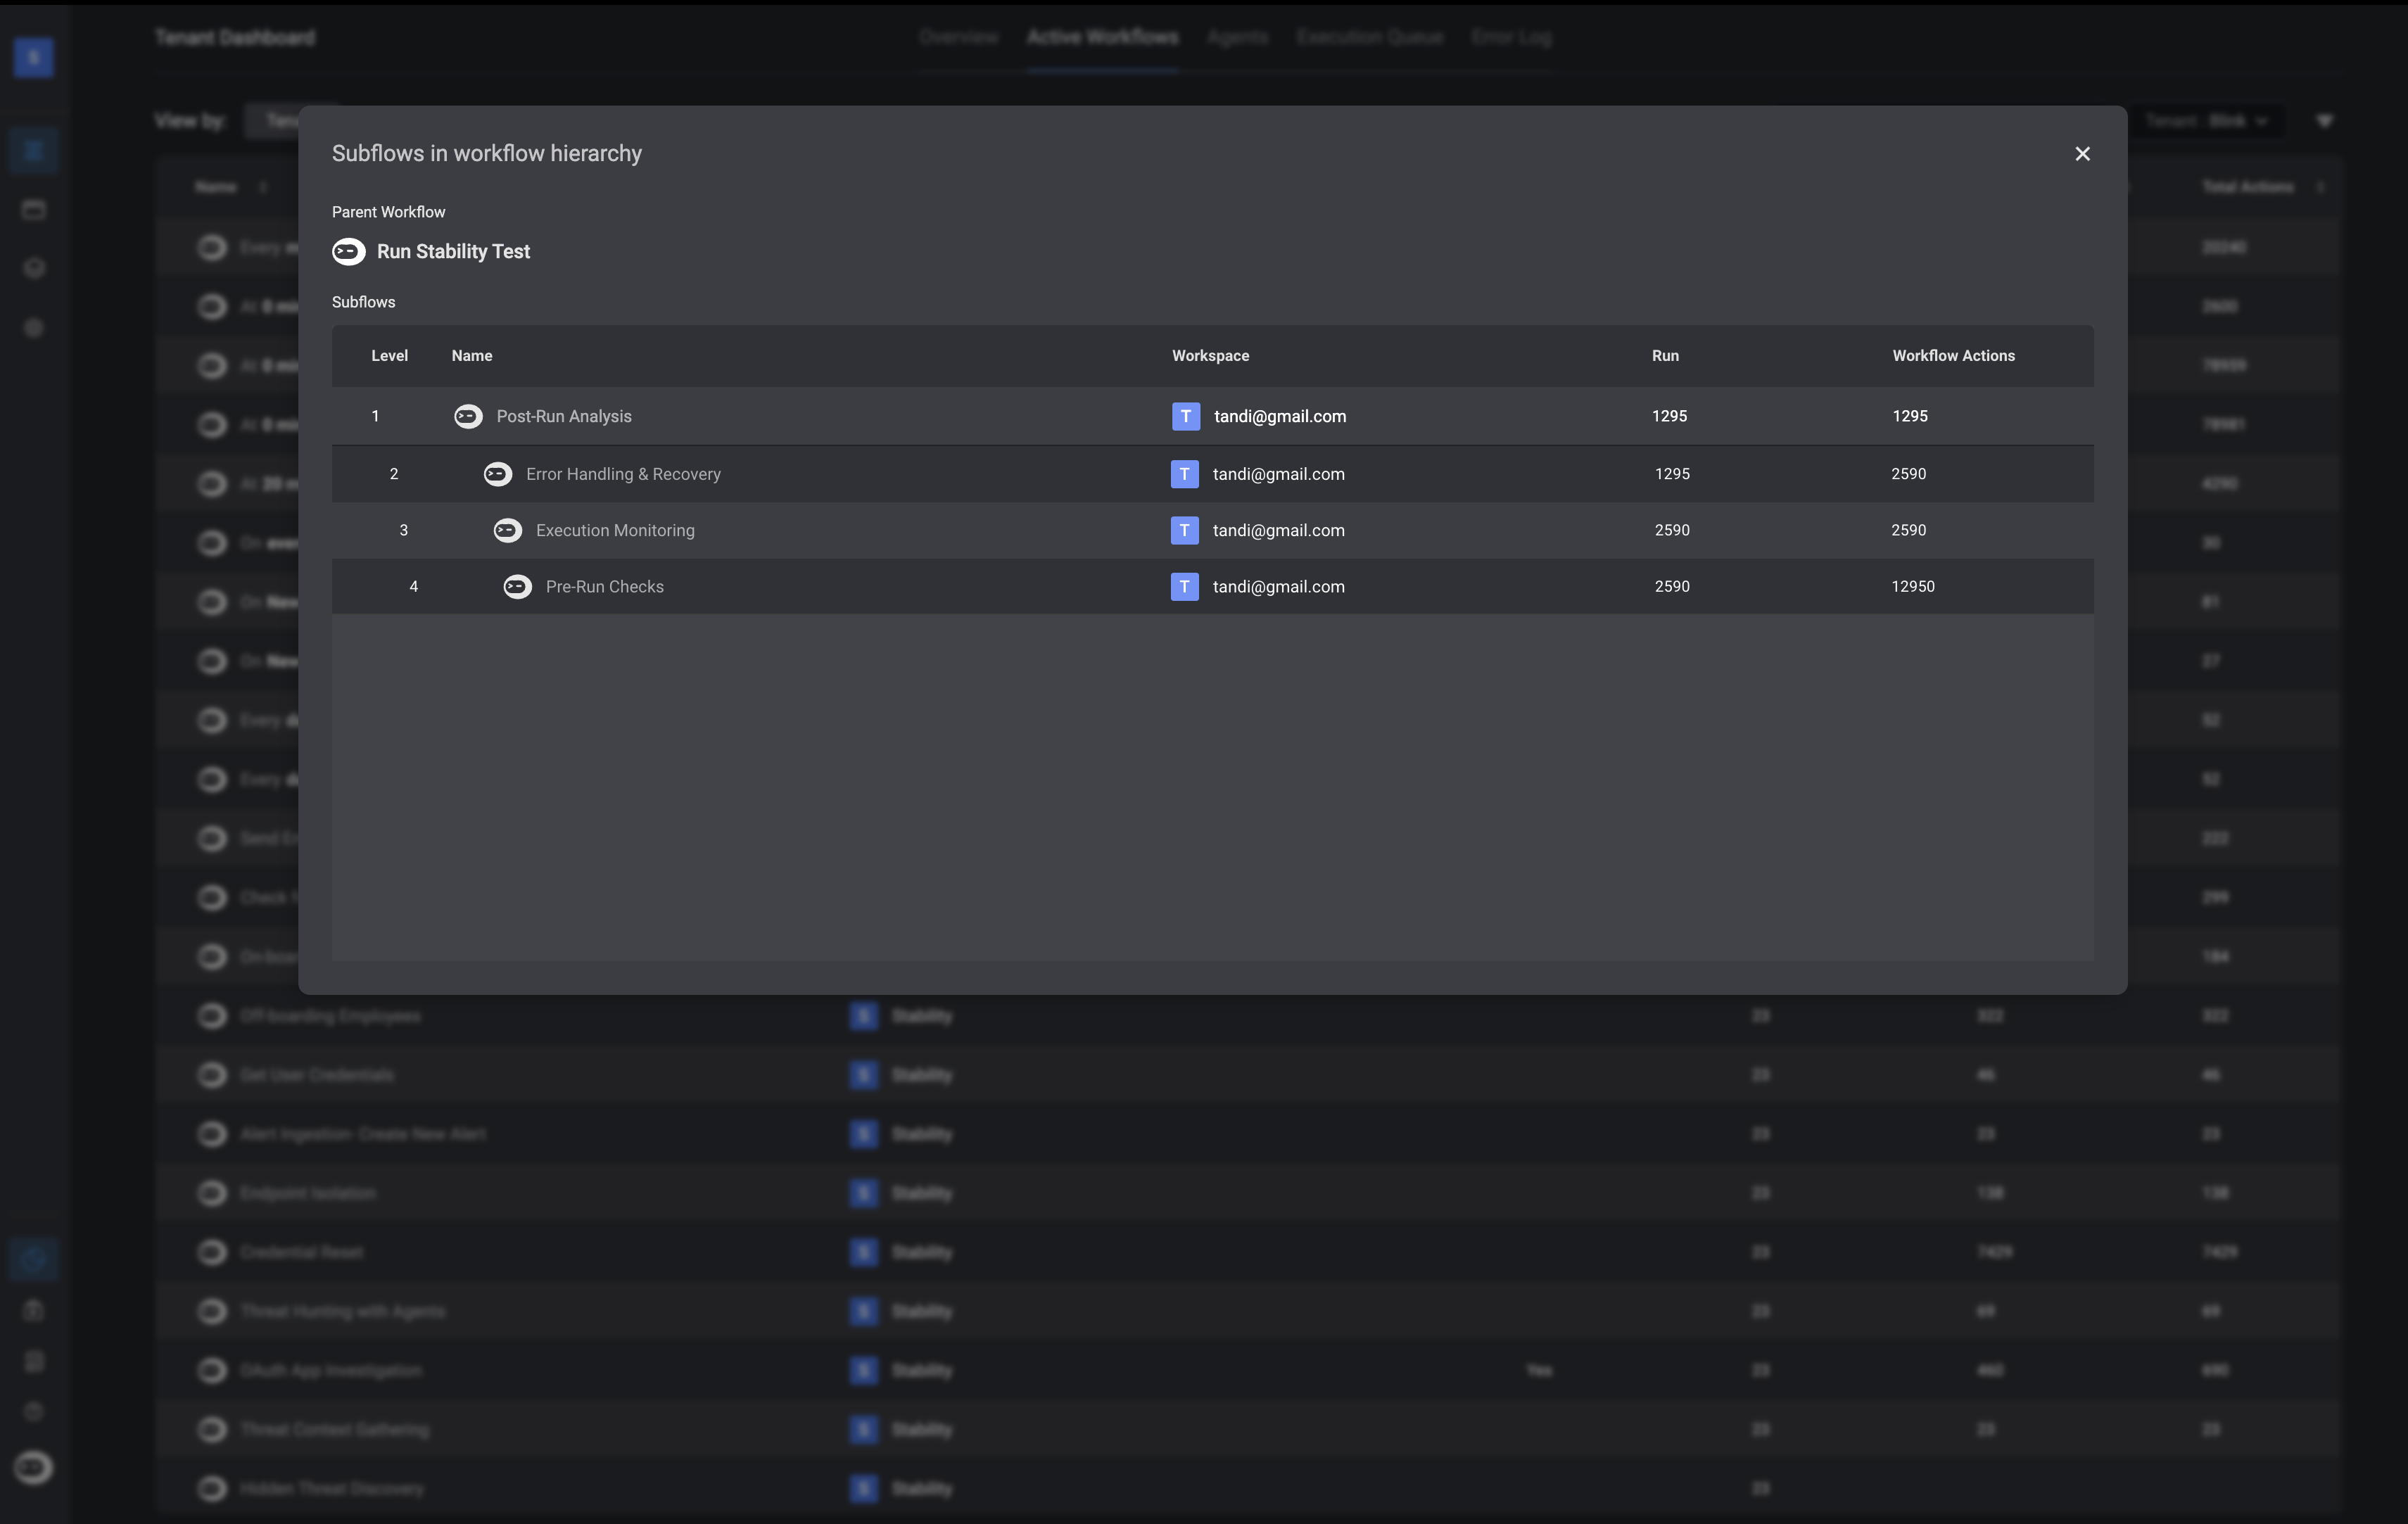
Click the icon to open the Subflow Hierarchy popup. This view displays all subflows associated with the parent workflow and provides key details about each one, including:- Parent Workflow – The name of the workflow in which the subflow is used
- Level - The nested step level of the subflow within the parent workflow.
- Name – The name of the subflow
- Workspace – The workspace where the subflow was created
- Runs – The number of times the subflow has been executed
- Workflow Actions – The number of actions defined within this specific subflow.
Agents
The Agent Tracking Dashboard gives you a comprehensive view of agent activity across your tenant and workspaces. It highlights how agents are being used, tracks data processing, and surfaces usage trends over time. With this visibility, you can effectively monitor agent performance, optimize resource allocation, and ensure you stay within your quota limits.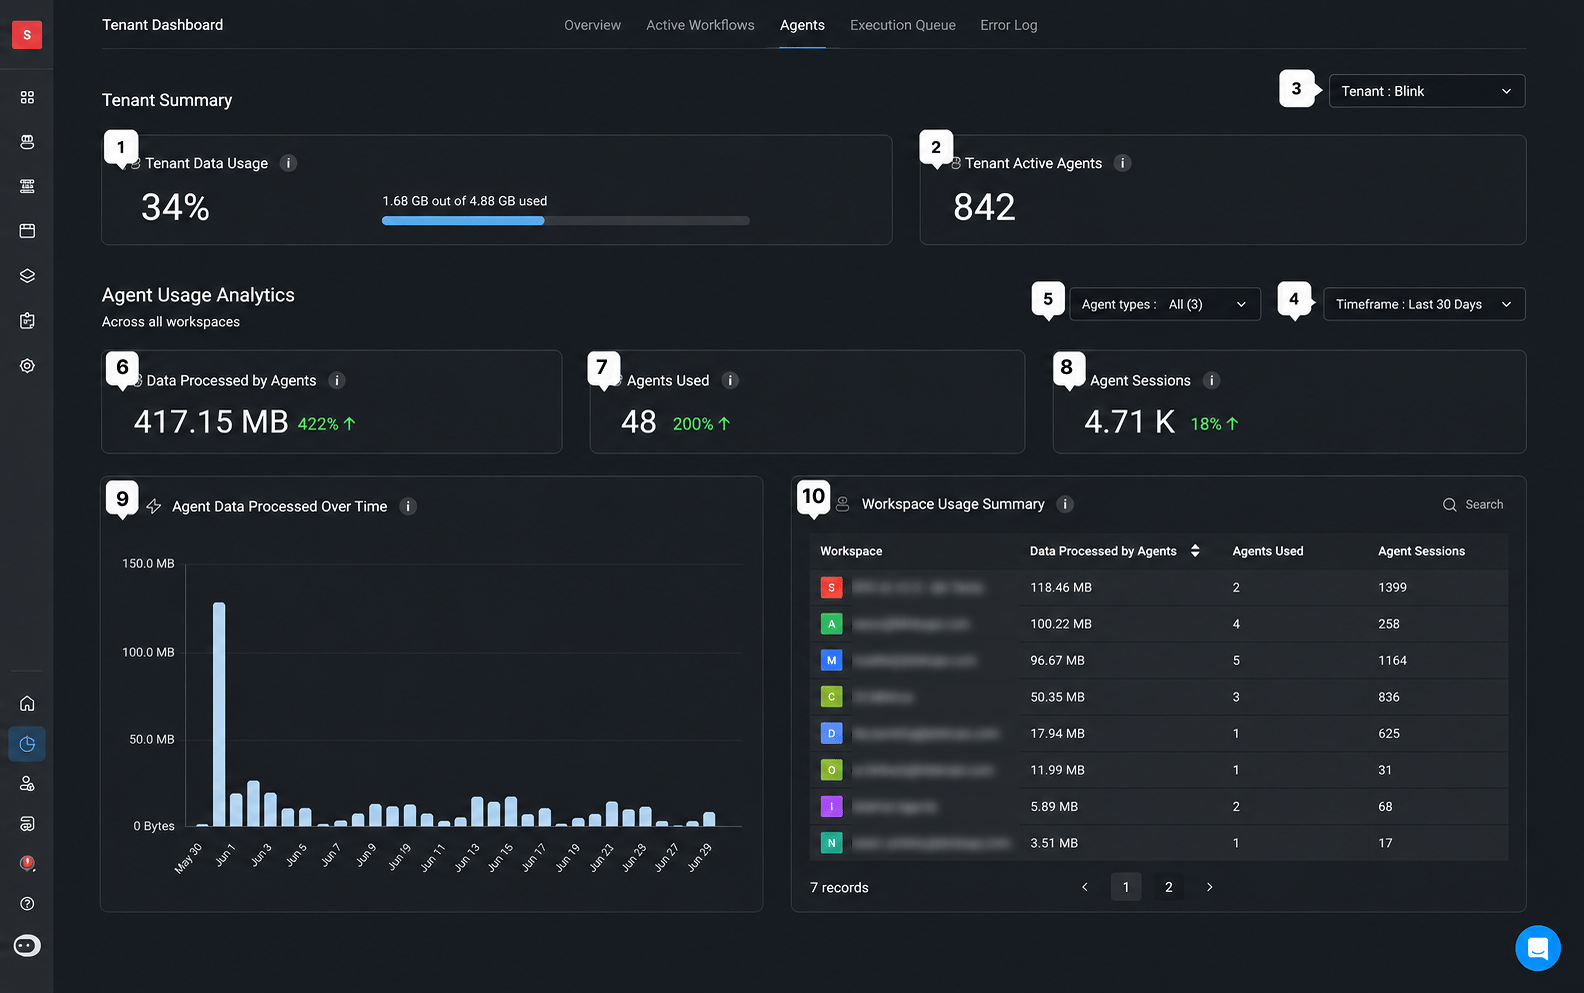
Execution Queue
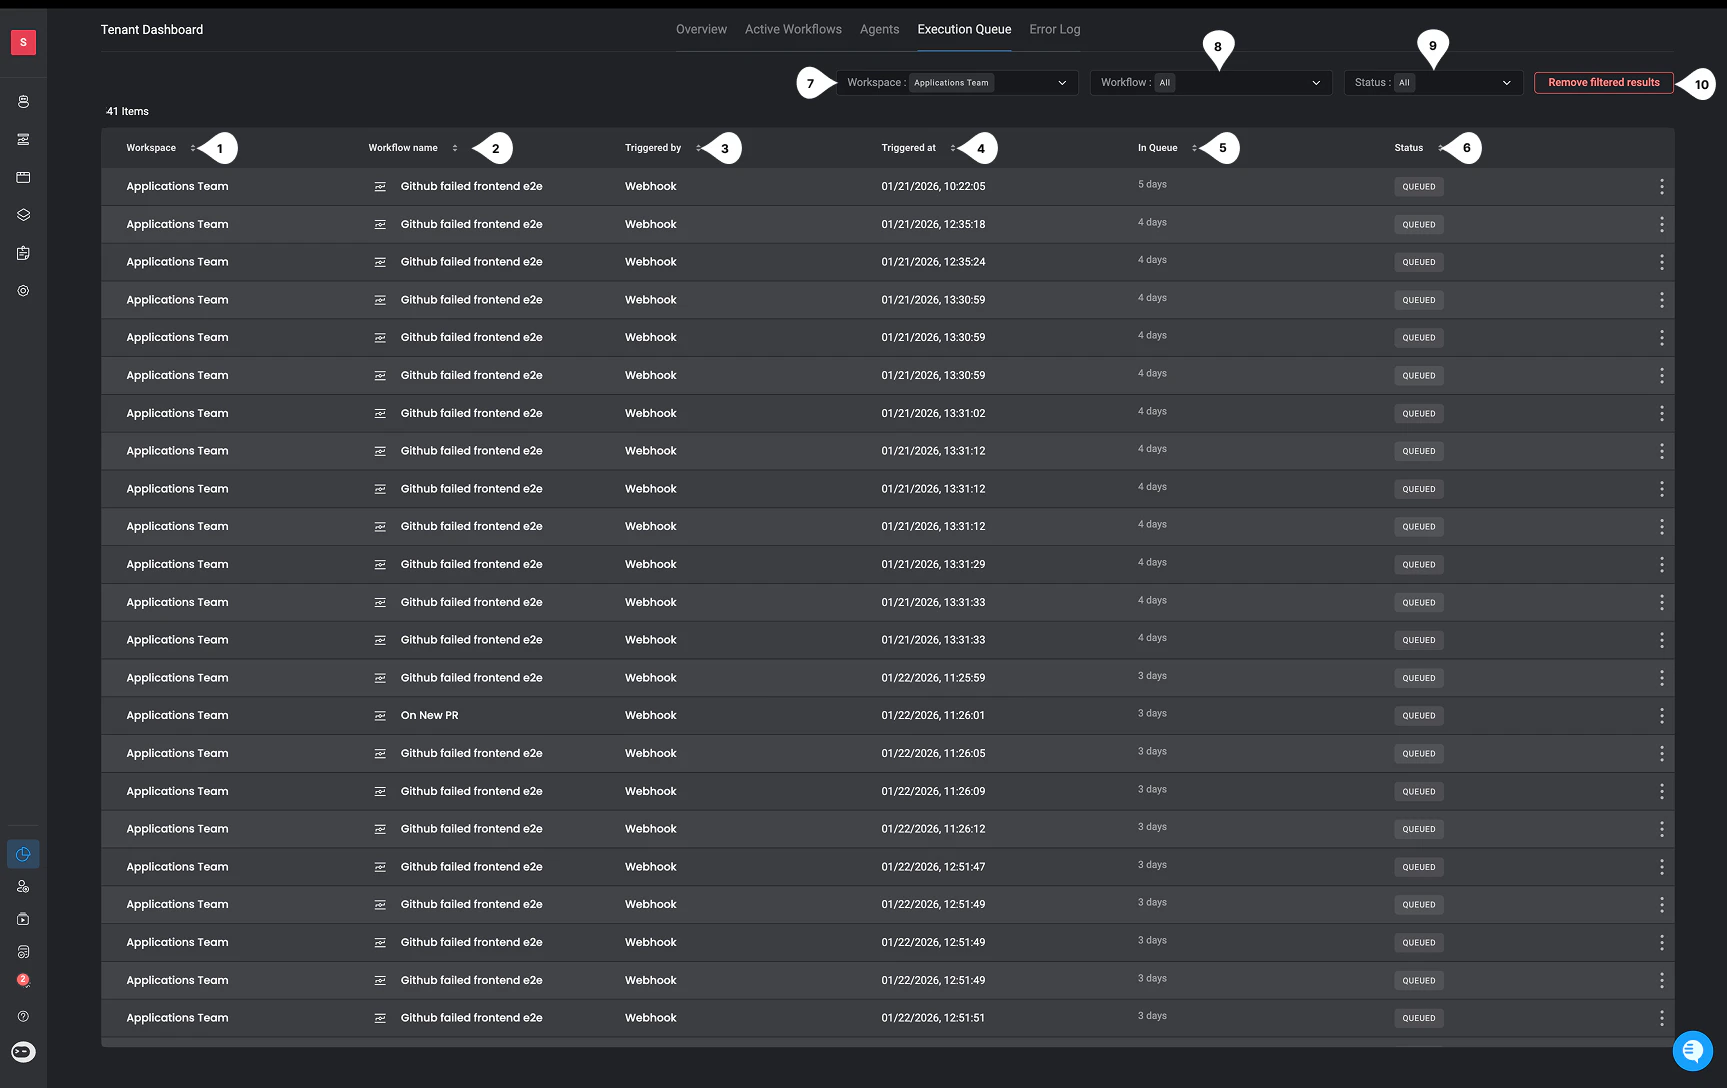
The Execution Queue Dashboard provides a centralized view of execution activity across your tenant and workspaces, showing how many workflows are currently running and how many are waiting in the queue. It reflects how the execution queue controls the number of workflows that can run concurrently across the Blink platform, when the maximum capacity is reached, additional workflows are temporarily queued and automatically start as soon as resources become available. This queuing is typically brief (only a few seconds) and helps maintain consistent performance and overall platform stability, even during peak usage.To learn more about execution queue limitations, refer to the Workspace Limitations documentation.
Activity Status
In your workspace, click the Activity Status button in the top-right corner to view the number of workflow executions that are and those that are .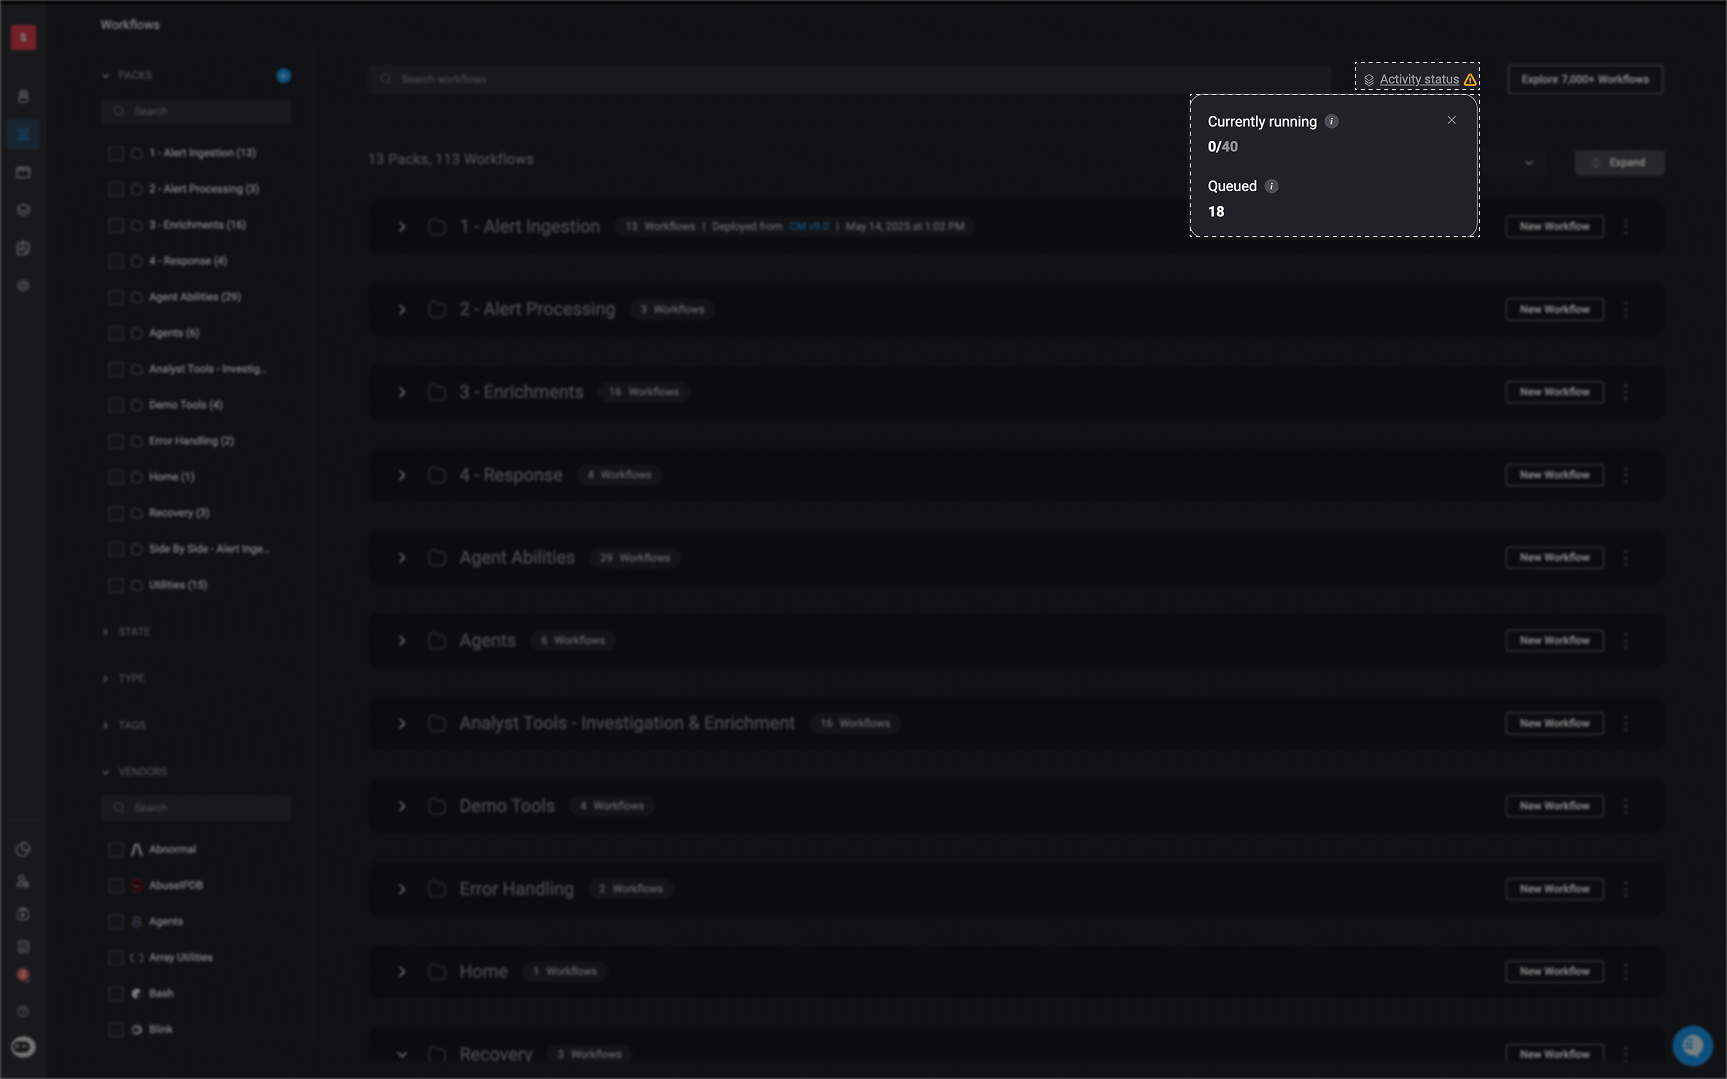
The Tenant Dashboard- Execution Queue
Error Logs
The Error Logs section provides a detailed, real-time view of all failed workflow executions across your selected tenant and workspaces. This table allows you to quickly identify which workflows encountered errors, when they occurred, and what caused them. With powerful filtering, search, and drill-down capabilities, the ‘Error Logs’ help teams troubleshoot failures efficiently and maintain the reliability of automated processes.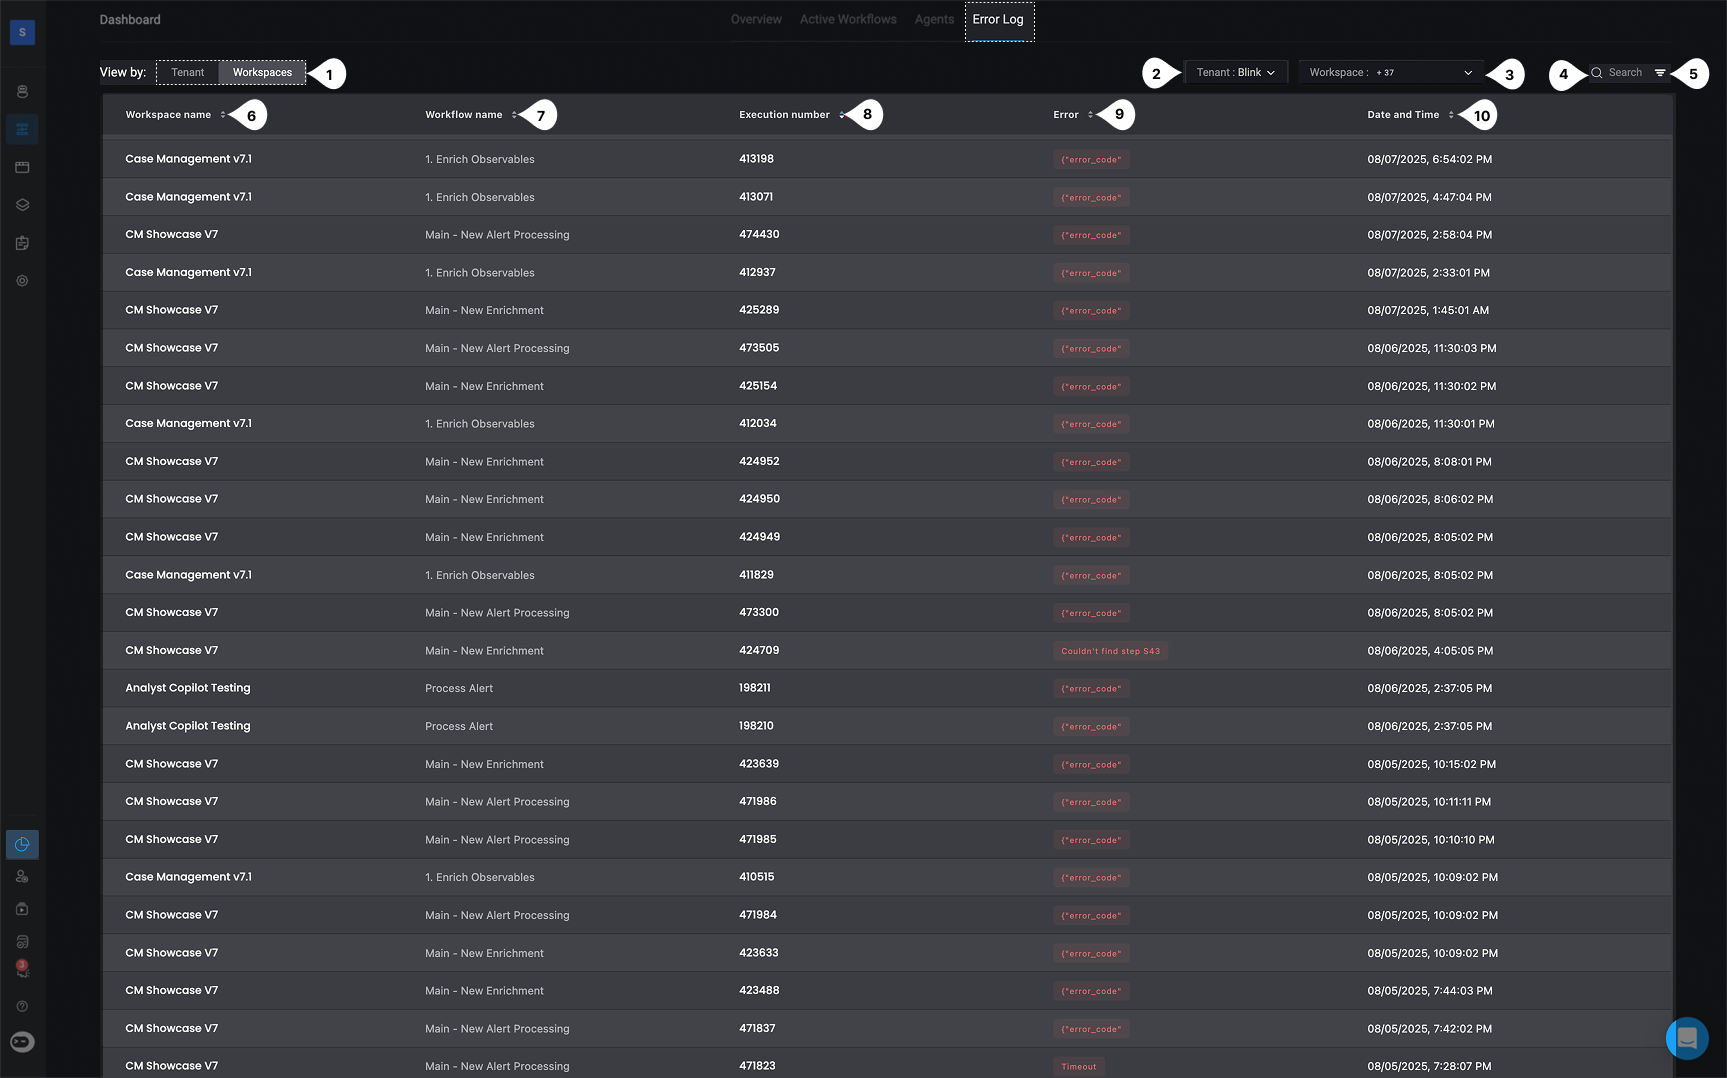
Note: The View by: Tenant is only available to users with the Tenant Admin role who have the
accounts:view permission